A big reason why you should get a modern cloud-based POS system like StoreHub for your business is all the reporting it can do for you.
How?
Well you run and manage your business with your point of sale (POS) system on a daily basis. So there’s a lot of data for it to capture.
And here’s the part where this business management solution helps you make smart data-driven for your retail or F&B business:
The system gathers all the information it has and generates insightful data analytics and reports for you, which let you know exactly how your business is doing.
Here are some of the reports StoreHub can generate for your business:
1. Best Selling Products Report
As a retailer, it’s important to know what your best selling products are so you can:
- Order and sell more of your best selling products
- Run promotions to sell products that aren’t as popular
- Stop selling your worst selling products that are unprofitable
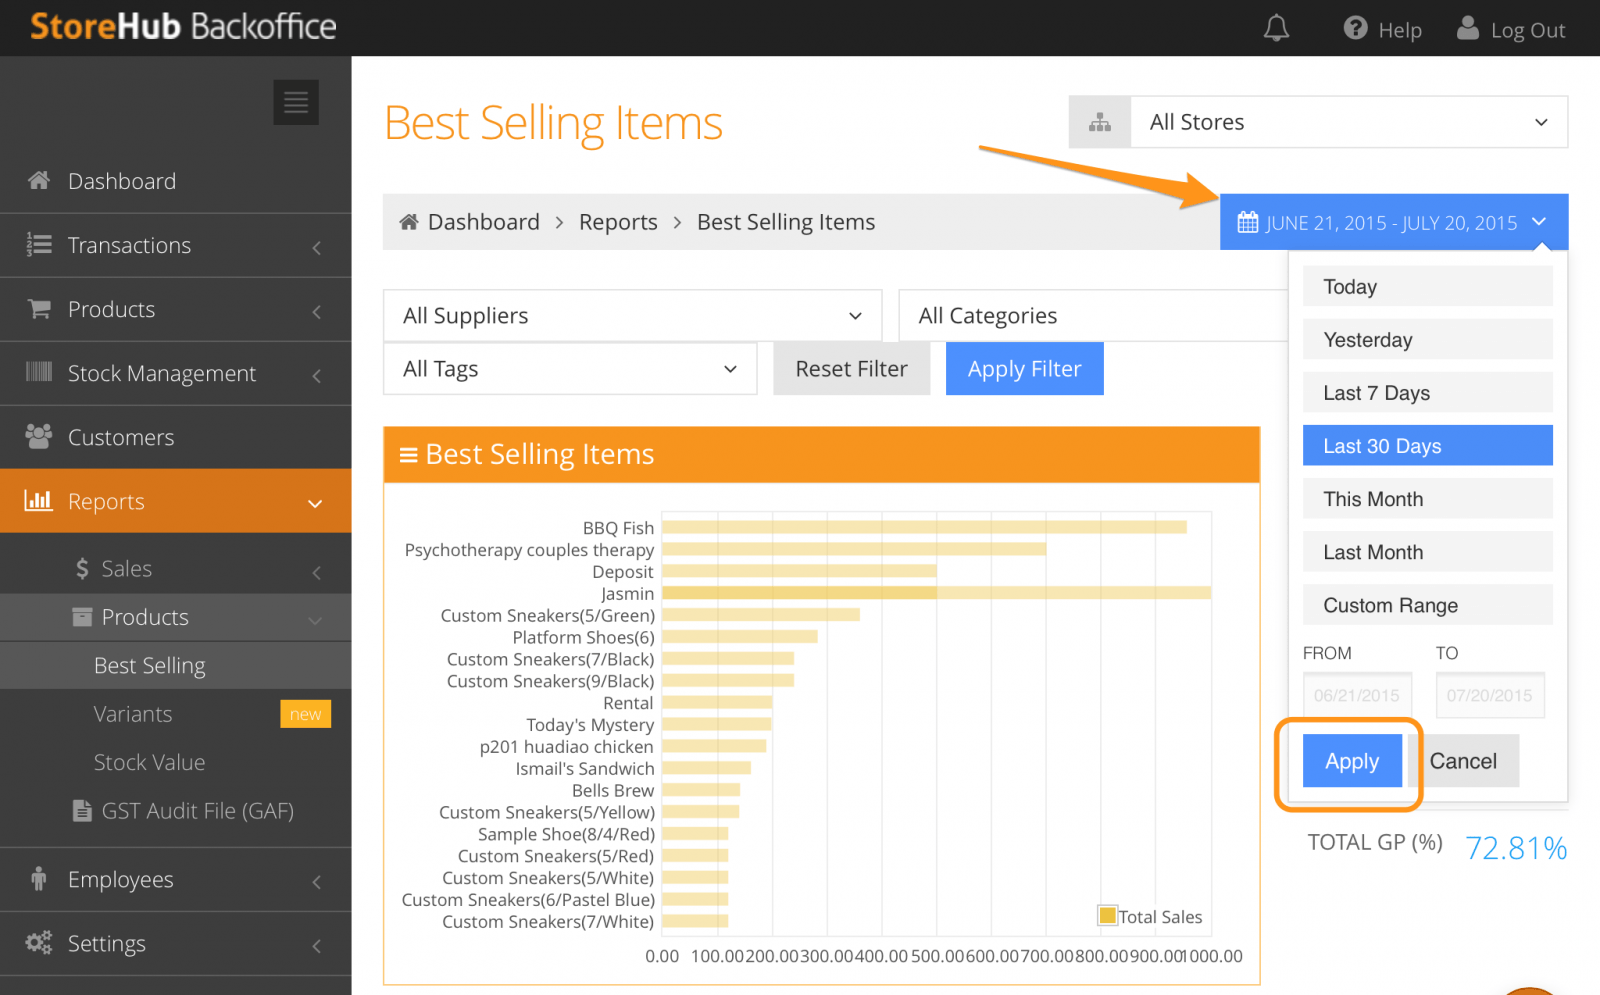
Most of our customers say that our Best Selling Products Report is the most useful report for them. The solid data it provides helps them make specific product-related decisions on making more profit and propelling their business to greater heights.
In the StoreHub BackOffice, you can filter your best selling products by timeframe, supplier, categories, and tags.
The StoreHub Best Selling Products Report will tell you the:
- Total Sales – Total sales made in a given timeframe
- Total Sold – Amount of items sold in a given timeframe
- Sale/Item – Average sale amount per item
- Cost/Item – Average cost amount per item
- Total GP (%) – Total gross profit in percentage
2. Daily Sales Report
Knowing your daily sales helps you maximise your sales transactions.
Imagine this scenario:
Your Daily Sales Report says that you’ve sold 10x more products every Saturday in the past 3 months. This tells you that you should increase the number of staff on duty so you can provide better customer service.
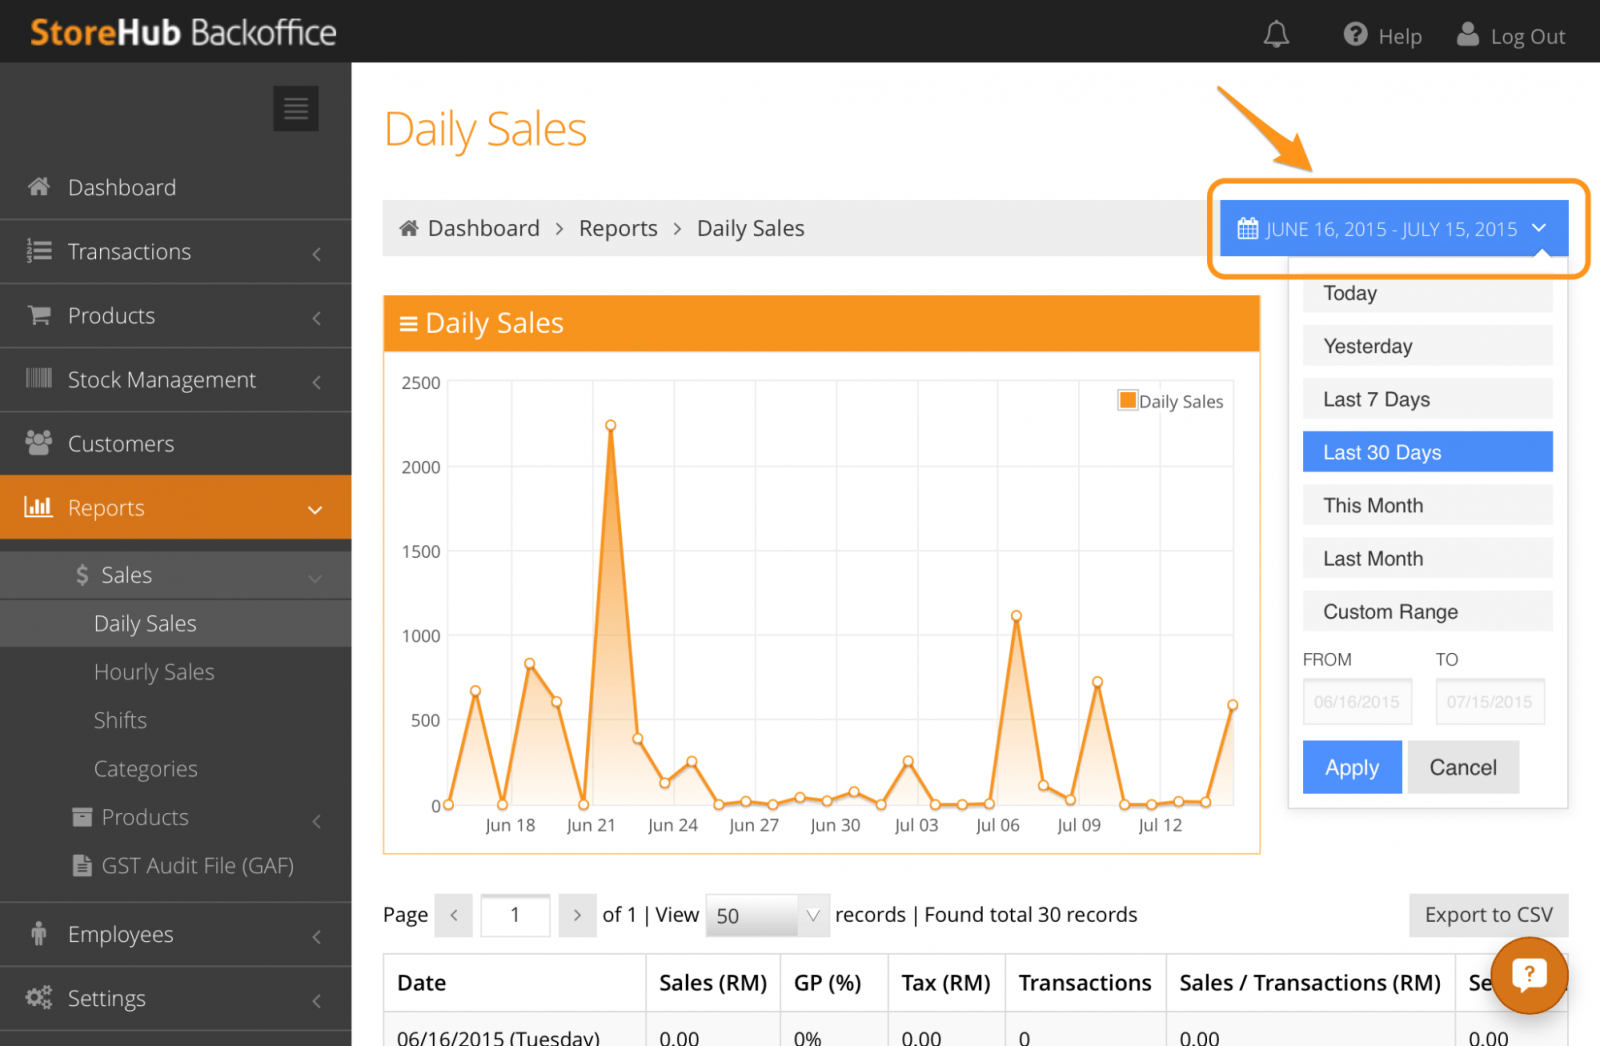
Your Daily Sales Report lets you know how your business is doing on a daily basis. This is great, especially if you own a fast-paced business.
The StoreHub Daily Sales Report tells you the:
- Net Sales – Total daily net sales made in the given time frame (without rounding, service charge and tax); Net Sales + Rounding + Service Charge + Tax = Total Tendered
- Rounding – Total amount that has been rounded off will display in this table
- Service Charge – Cumulative amount of service charges applied for that day
- Tax – Total tax collected over the given time frame
- Total Tendered – Total amount of payment transacted
- GP (%) – Total gross profit in percentage
- Transactions – Number of transactions within the given time frame
- Net sales/Transactions – Average sales value of a transaction
3. Hourly Sales Report
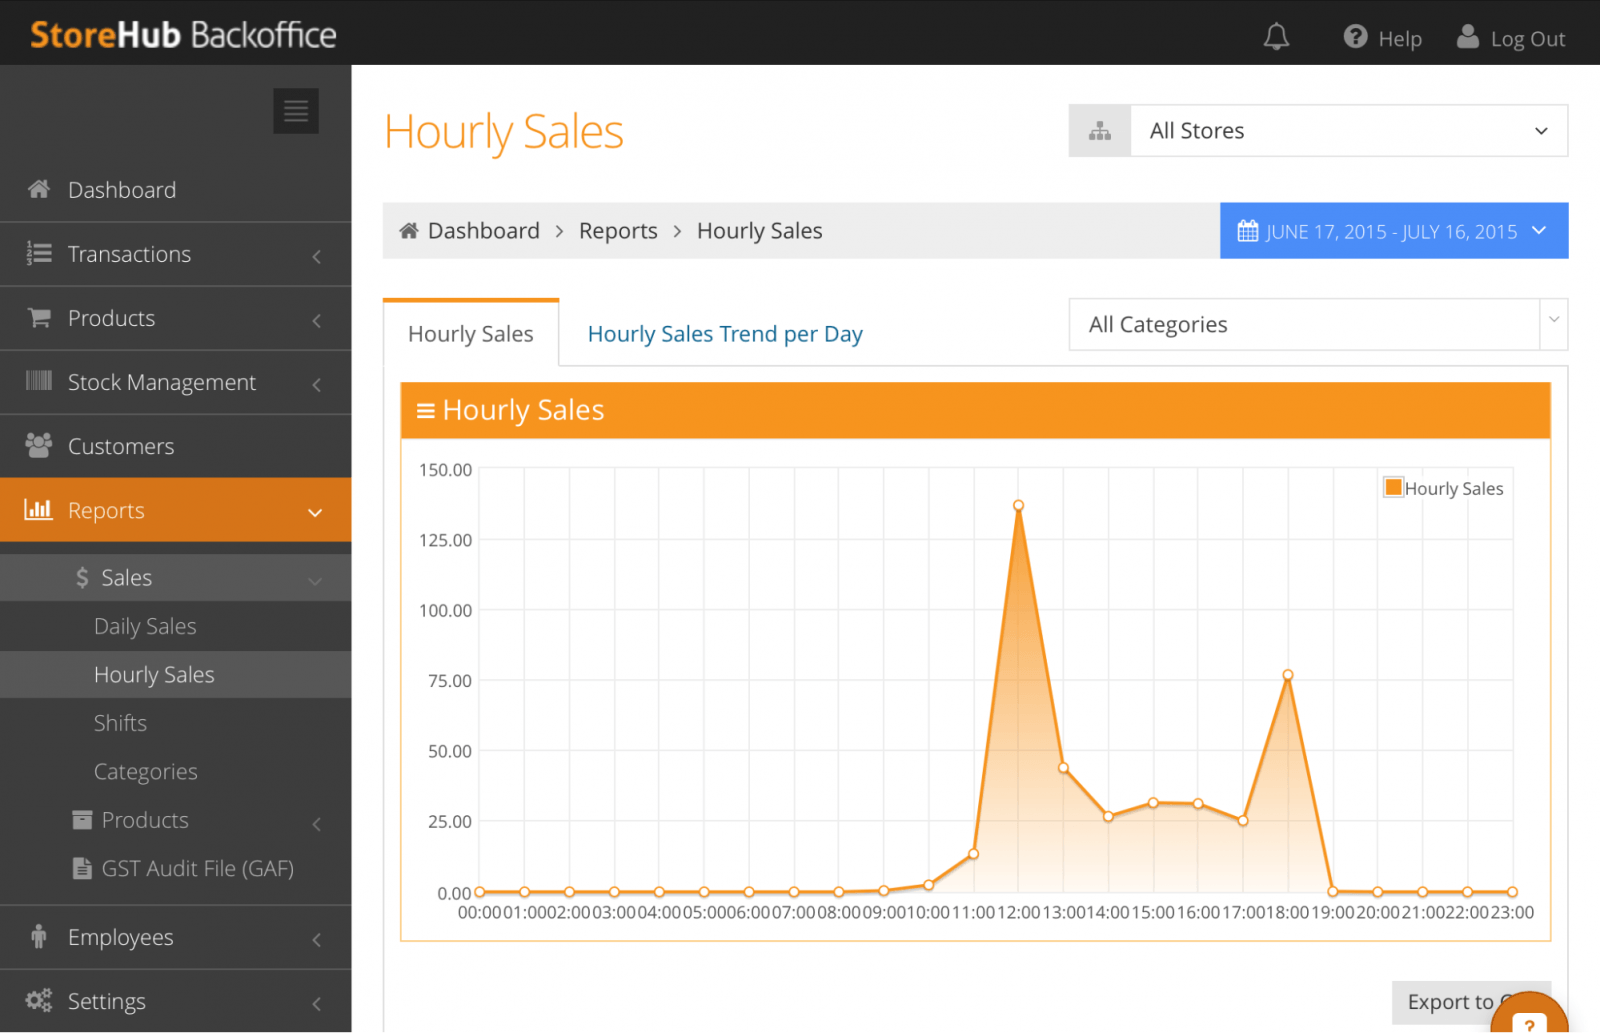
An Hourly Sales Report helps a business owner optimise sales by the hour. This is important so you know your peak hours and off peak hours.
Once you know that data, you can enhance your business with actions like:
- Run special promotions during low peak hours (e.g.: Buy 1 Free 1)
- Schedule more staff to work during peak hours
There are two StoreHub Hourly Sales Reports:
- Hourly Sales Report – Graph and table of the average amount of sales and transactions done (in a desired timeframe) over 24 hours.
- Hourly Sales Trend Report – Graph of hourly sales over days, displayed hour by hour.
4. Sales Report by Categories
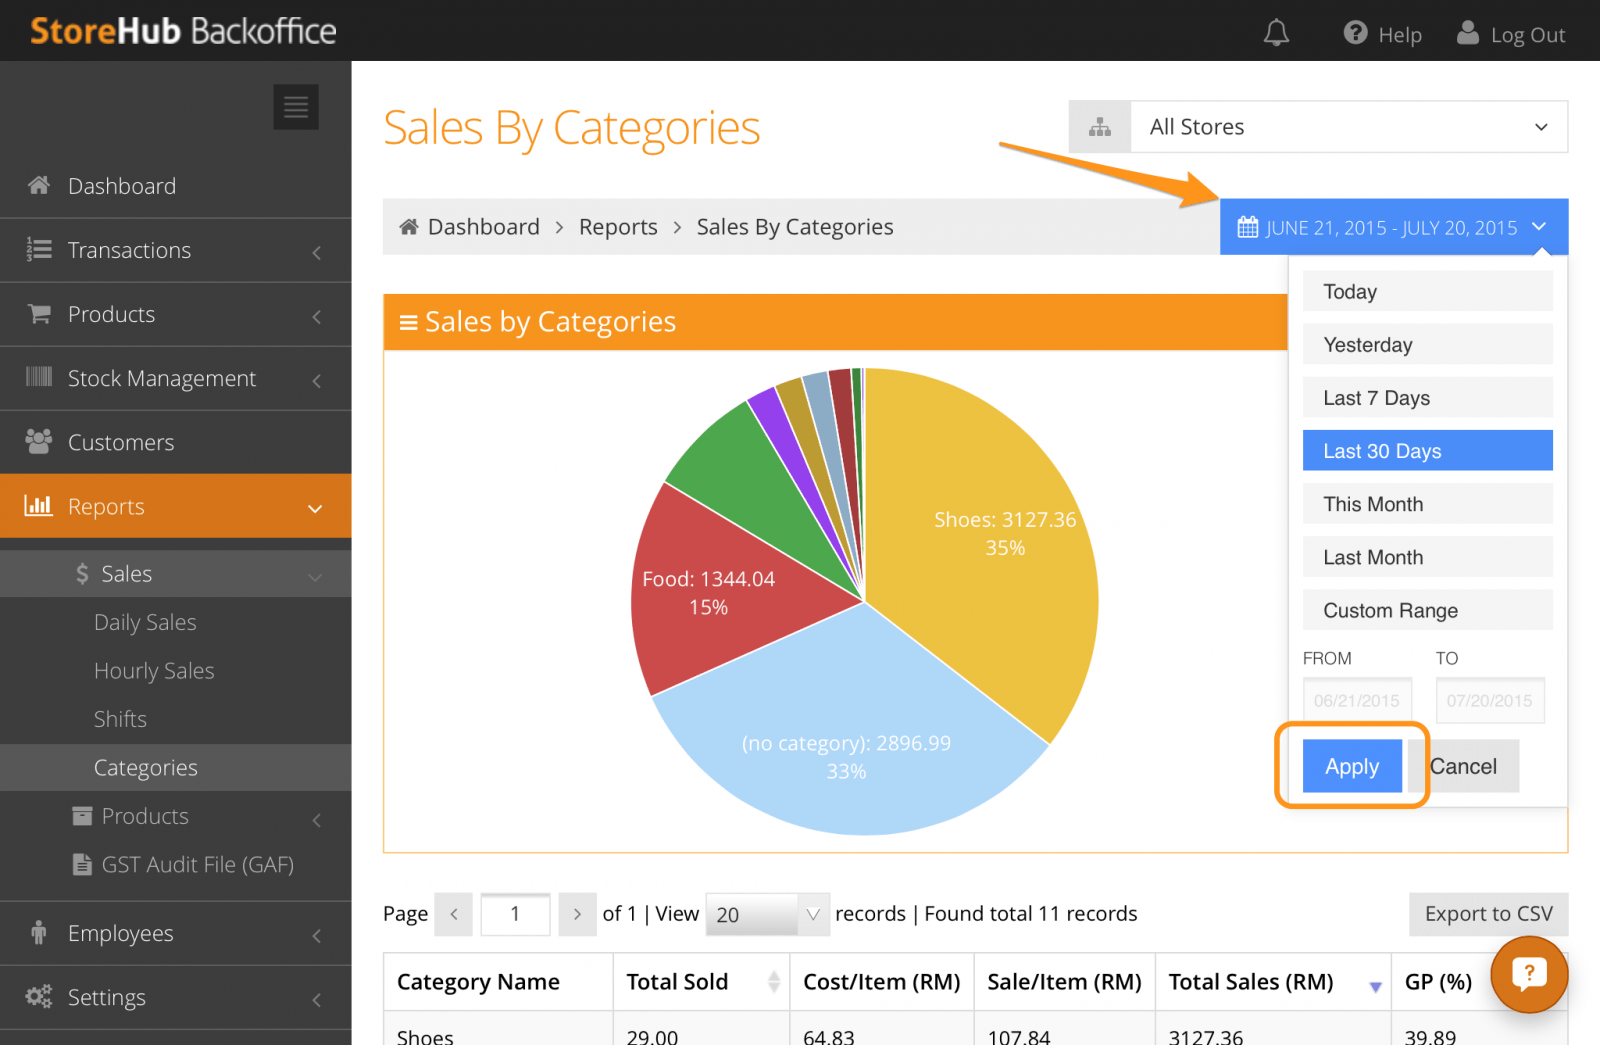
Did you know you can view your sales report by categories?
If you have segmented your products into categories under Manage Products, your BackOffice can generate a pie chart that shows the percentage of sales and total items sold by each category, all within a desired timeframe.
A category is a group that a product belongs to, for example, ‘Clothing’ or ‘Accessories’ or ‘Services’.
With the StoreHub Sales Report by Categories, you can see which of your categories sells best and least.
For example:
- Retail – Clothing or Accessories or Shoes
- F&B – Pasta or Soup or Dessert
This is great especially for businesses that sell multiple types of products/services.
5. Sales Report by Variants
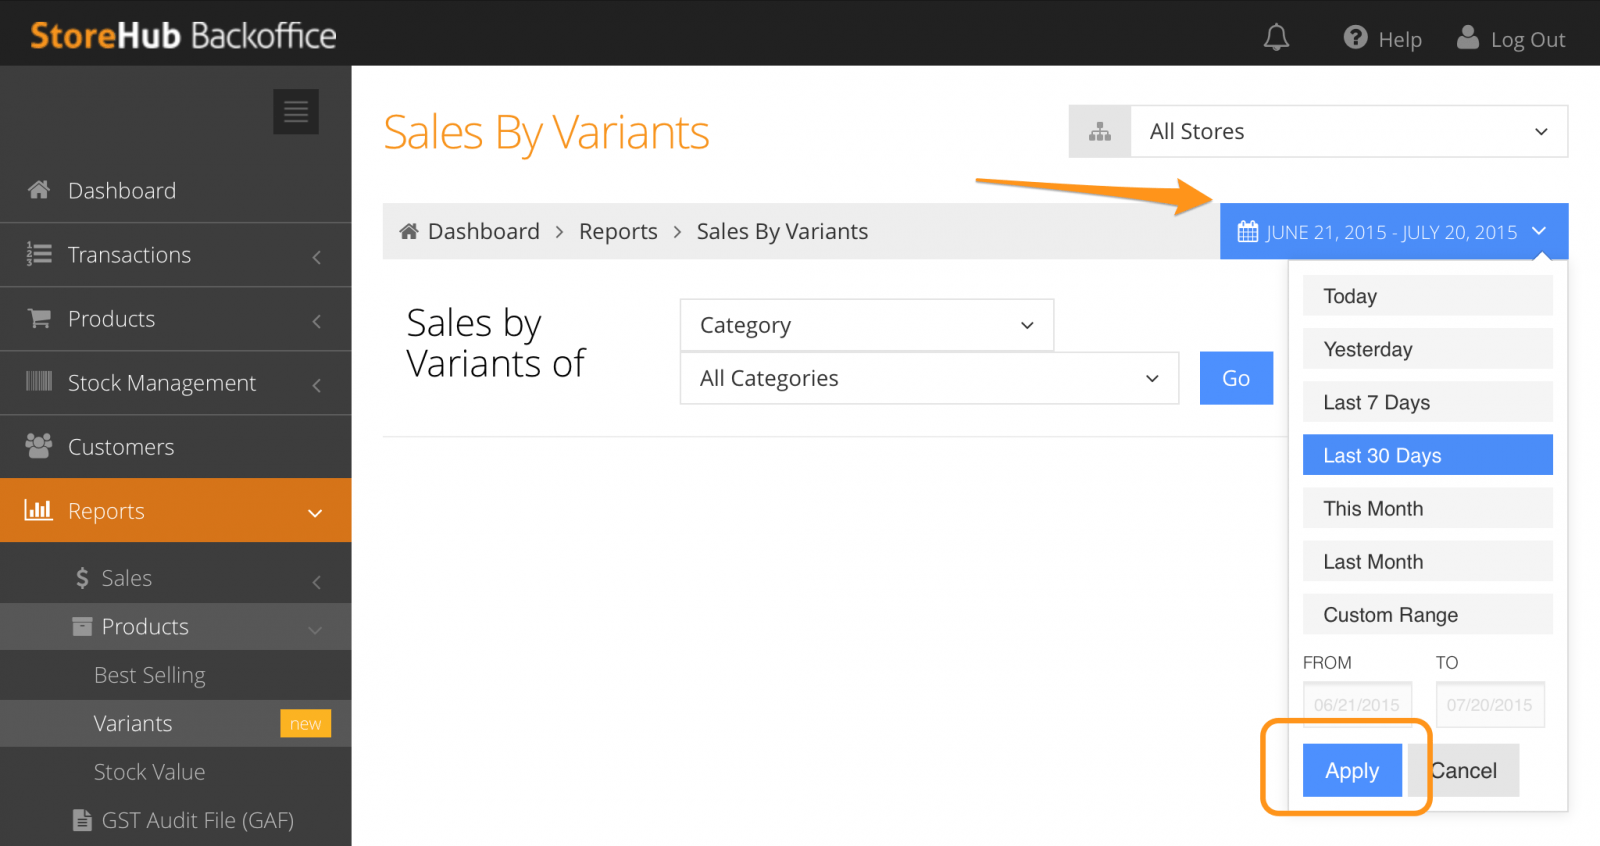
If your products have variants, you can view the percentage of your sales by products or category variants as well.
Variants refers to the variations of a product. Here’s how a Variant works:
- Variant group = colour
- Variant colour = black, red, white
- So if your main product is a t-shirt, its variations are the different colours it comes in (e.g.: black t-shirt, red t-shirt, white t-shirt)
You can view the StoreHub Variants Report according to categories or the products.
When viewing the variants report by categories, the report will show you the total sales for each variant available in a category or product.
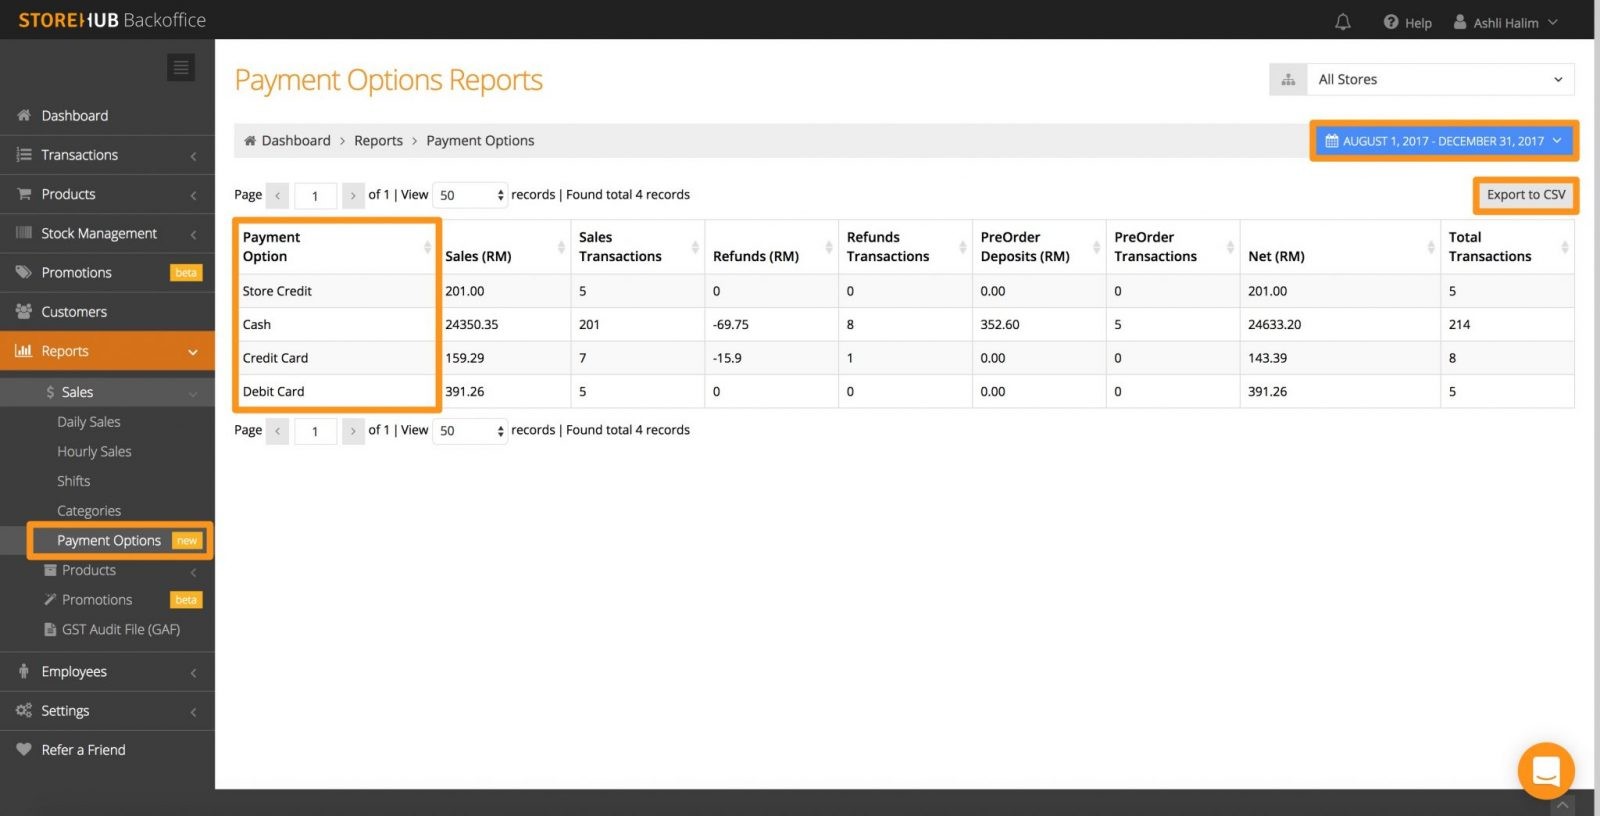
6. Payment Options Report
Each customer has a preferred payment method, be it cash, debit card, credit card, or ewallet.
As a business owner, you need to offer multiple payment options in order to create a smooth transaction process for all your customers.
It’s important for you to know what payment option is the most popular.
For instance if your customers’ preferred payment method is:
- Cash – You’ll need to have more small change on hand, and possibly work on a strategy to encourage your customers to pay using an ewallet, which is known to reduce human errors and processing fees for your business
- Debit or credit card – Finding a suitable merchant partner is essential so you don’t waste any money
- Store credit – You need to work on building a great loyalty programme that will attract your customers
- ewallet – See which ewallets are most popular among customers and include them in your list of accepted ewallets
Use the StoreHub Payment Options Report to view the number of transactions, total sales, refunds, and more, which are made with your payment options.
7. Stock Value Report
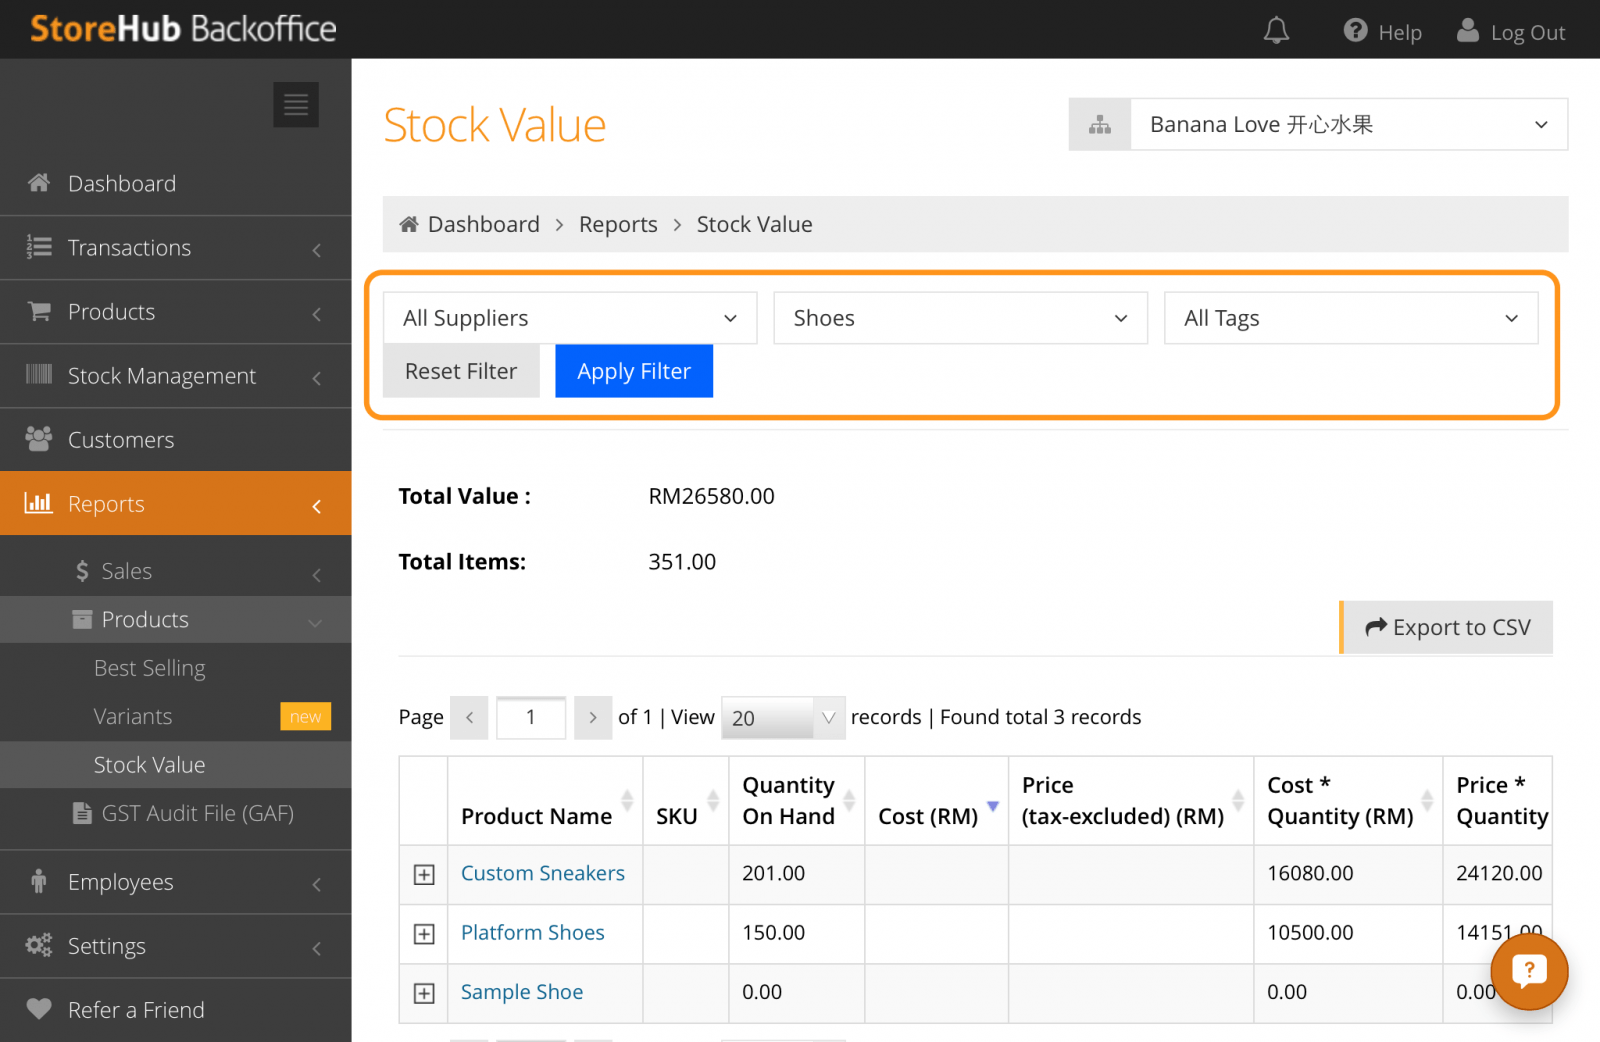
You probably have a lot of stock.
Do you know the quantities of each product and their total value?
This is important for any business owner, because you need to know if you’re wasting money on a certain product or if you need to switch suppliers for a certain product.
This is where the Stock Value Report comes in handy. It lets you know the specific amount of stock you have for specific products and their total value.
With the StoreHub Stock Value Report, you will be able to view information on your product with the total quantity at hand and its total value.
Get additional custom reports using Pivot Tables tool
Being able to analyse your data helps you make better business decisions.
And even with all the useful reports listed above, you sometimes need a custom report that is not available by default on StoreHub.
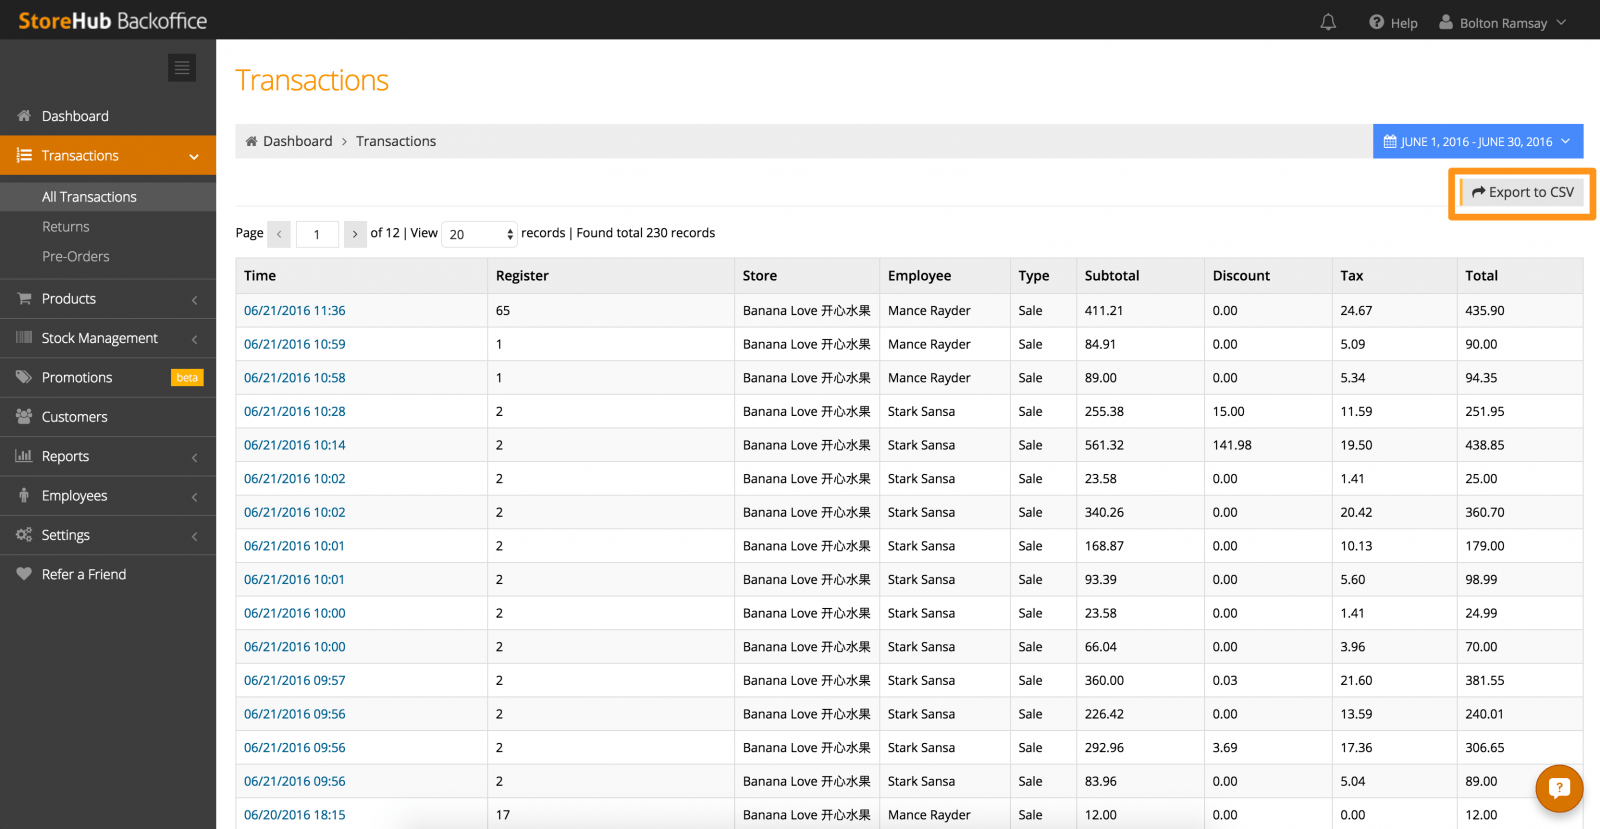
What you can do is download your raw data from your StoreHub BackOffice and use Pivot Tables (a tool that lets you to organise and summarise data for a custom report) to create your own custom report on either Microsoft Excel or Google Sheets.
Some reports you can come up with using Pivot Tables:
-
Sales Trend Report
-
Discount Report
- Sales Performance Comparison Between Multiple Stores
Power Your Business With StoreHub!
Click here to learn how StoreHub can help you manage and grow your business.